با سلام
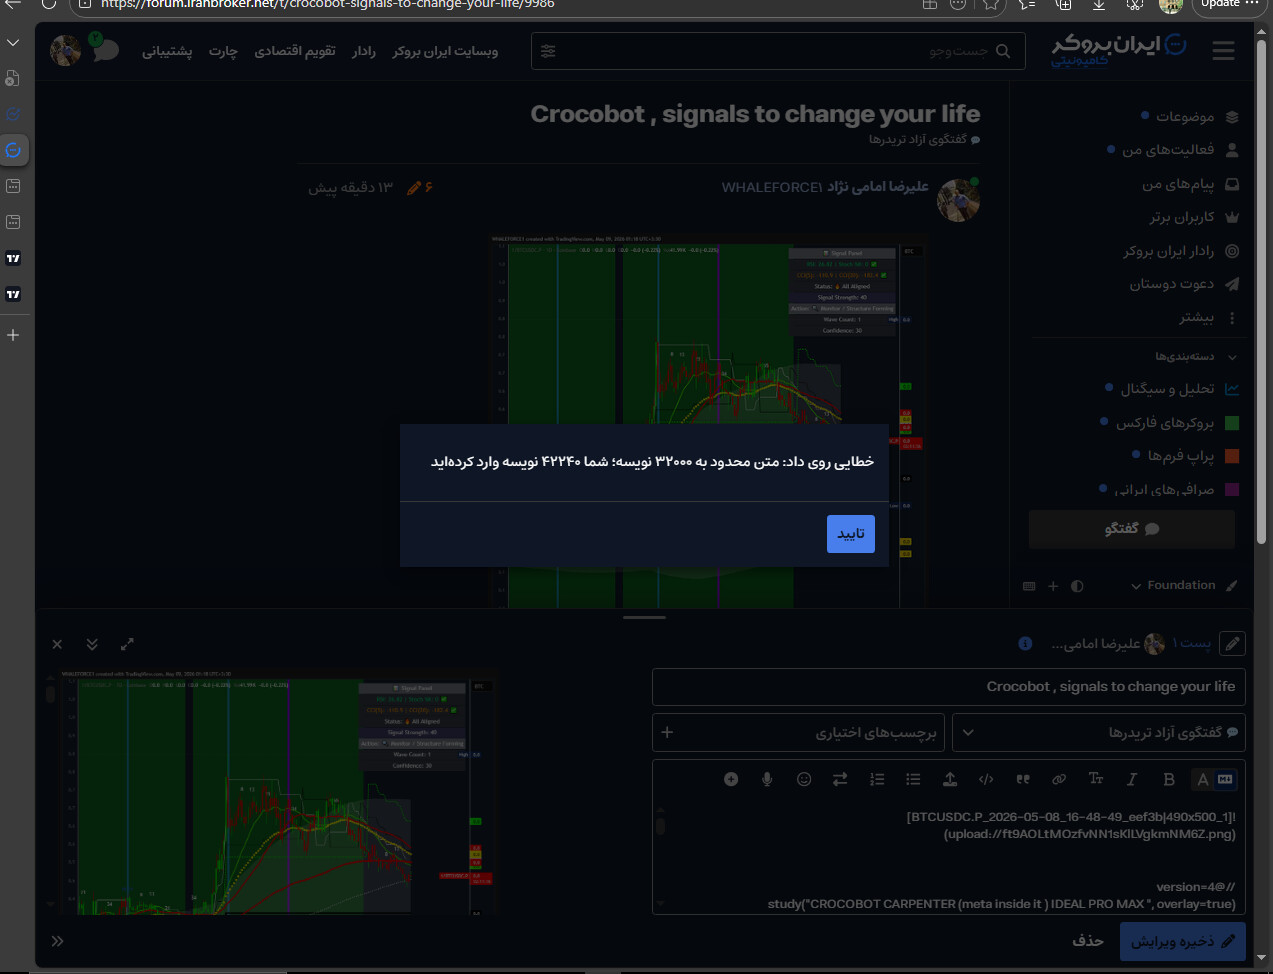
لطفا توجه داشته باشید به علت کمبود فضا اولین فایل در دو موضوع اما با یک عنوان منتشر می گردد.
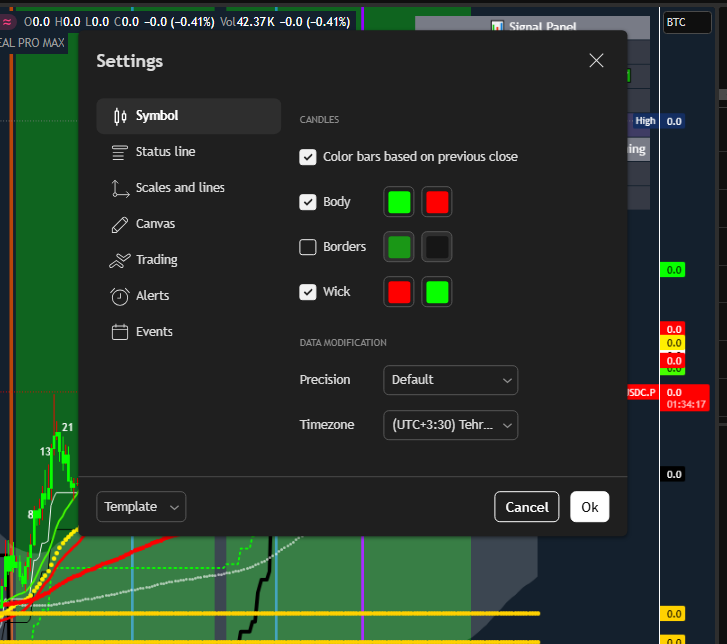
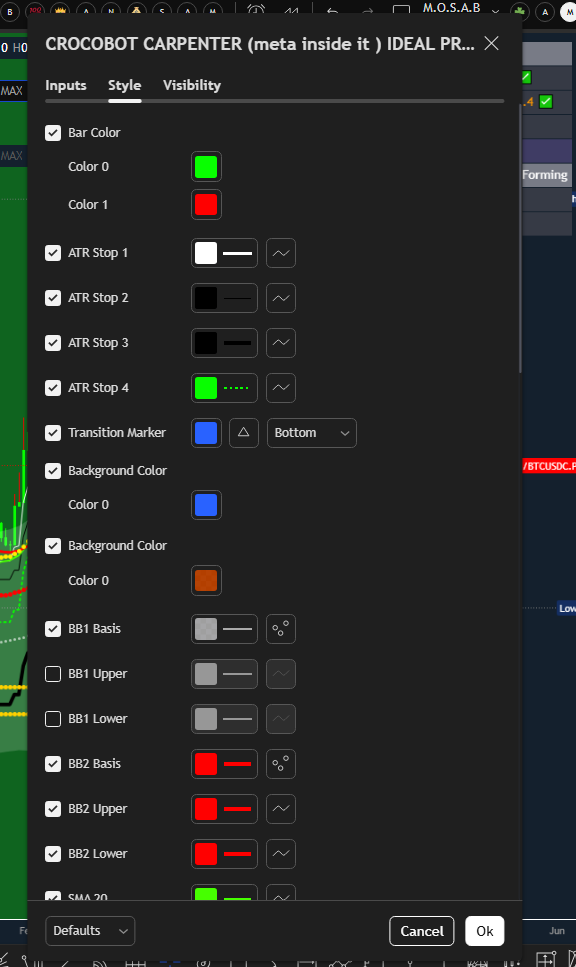
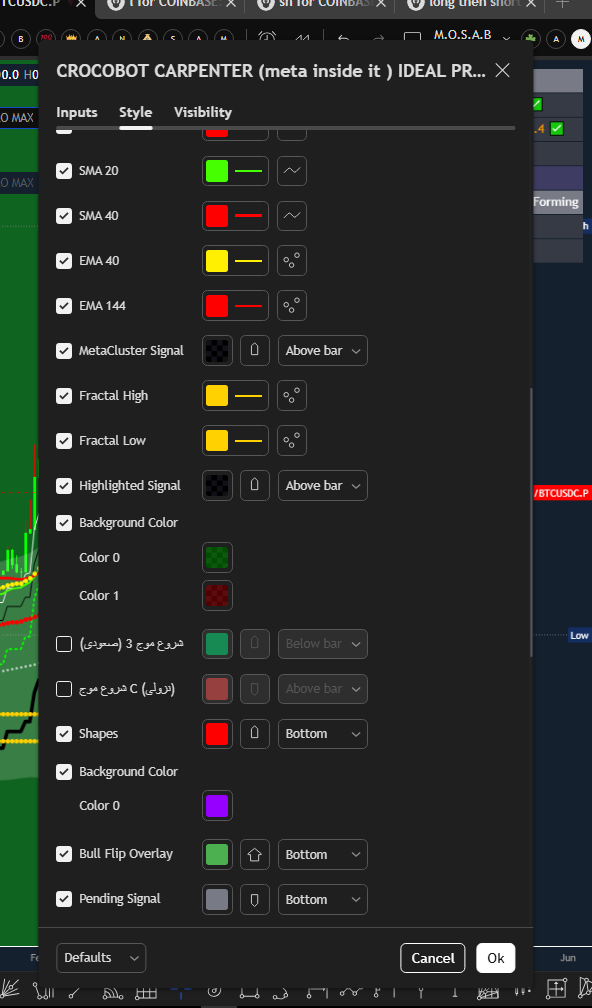
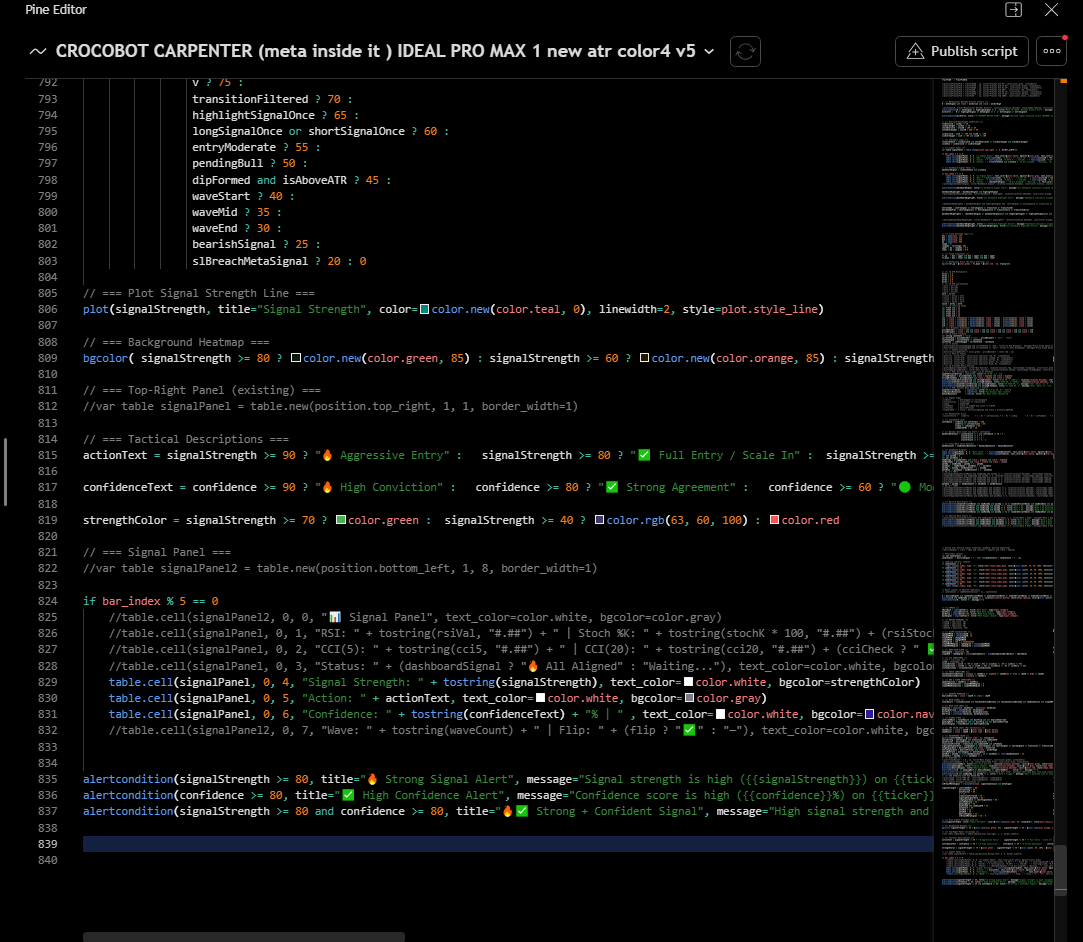
در اولین بخش ستینگ داخلی کروکوبات را در یافت خواهید کرد . مستدعی است در سیستم خود عینا همین ستینگ را پیاده سازی فرمایید .
اولین ابزار مشتمل بر 837خط می باشد که شما 400 خط اول را در این پست دریافت می کنید ، جهت جلوگیری از دریافت ارور توجه داشته باشید متون عینا کپی و پیست شود و از همه مهمتر خواهشمند است فضای پاسخ ها به پست را کاملا حرفه ای و کاملا مربوط به هر گونه سوال در خصوص پاین اسکریپت نگاه دارید :
//@version=4
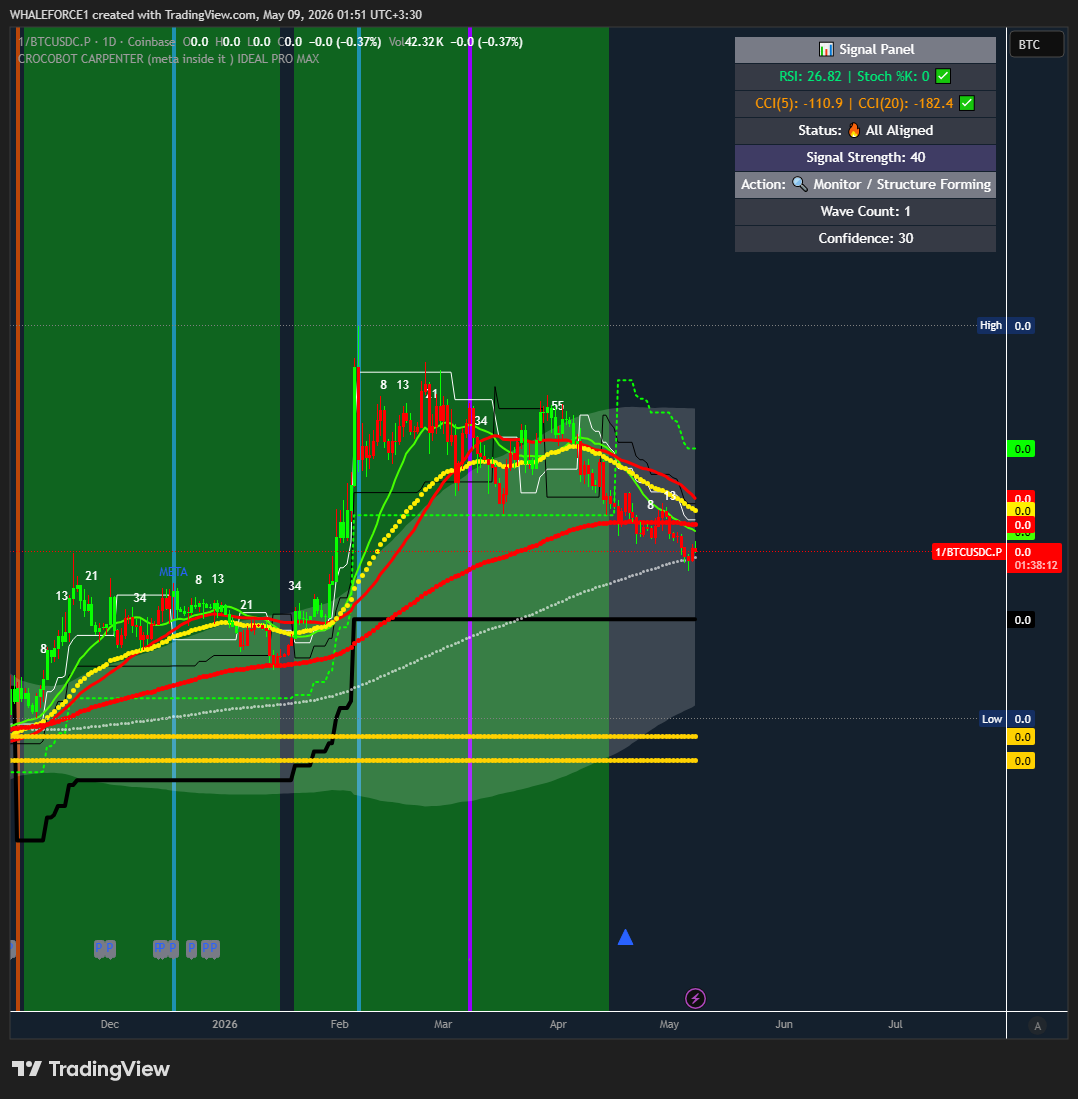
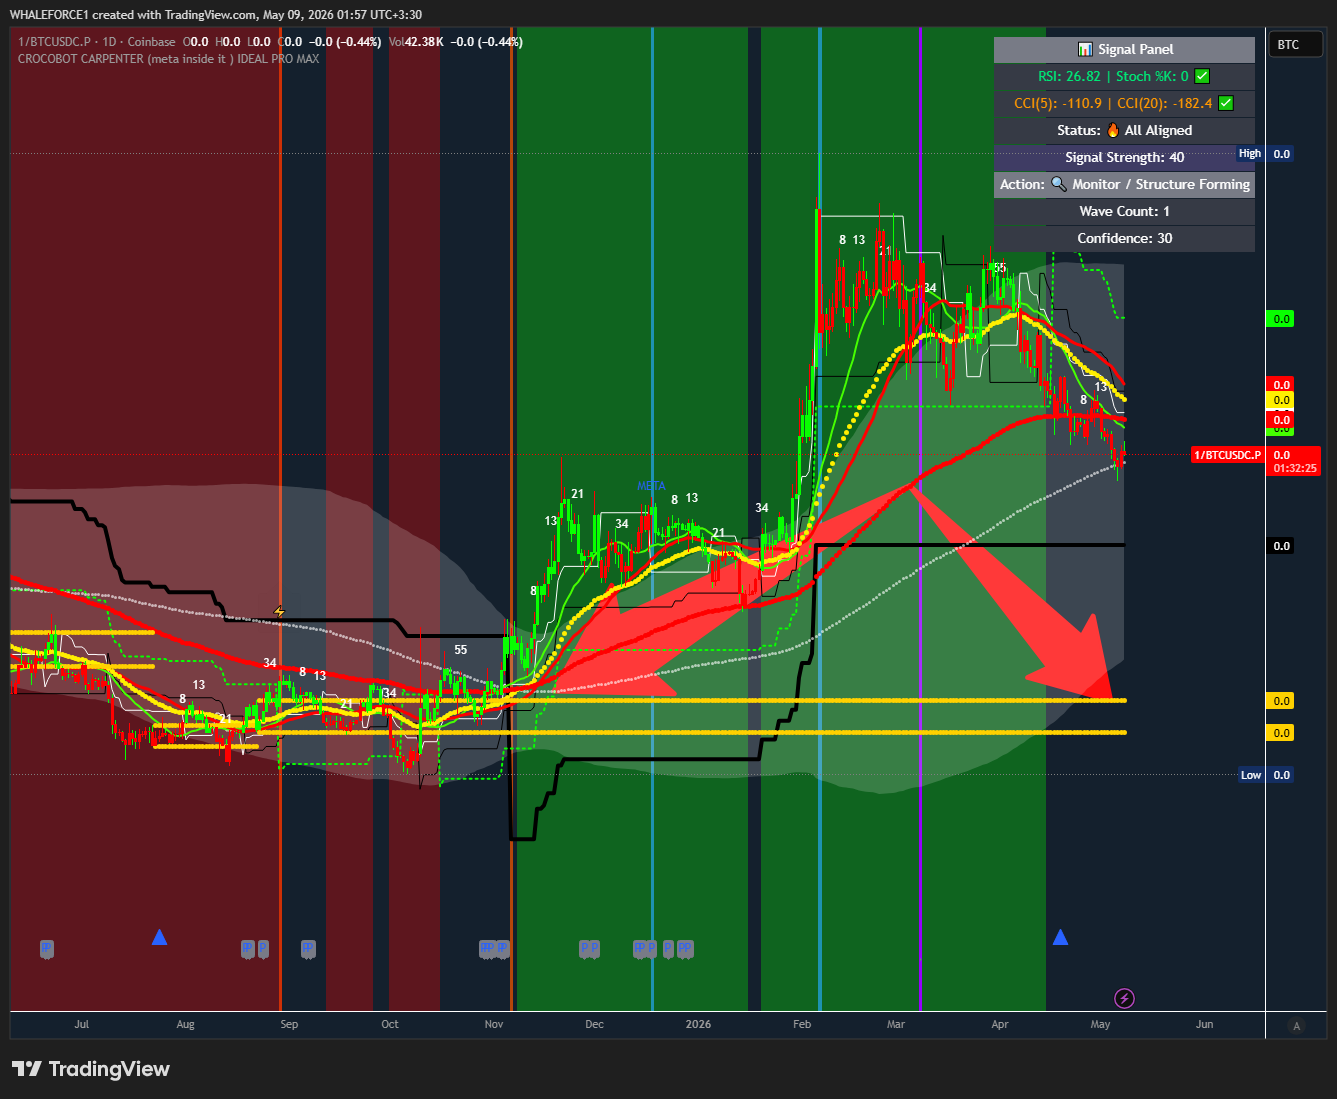
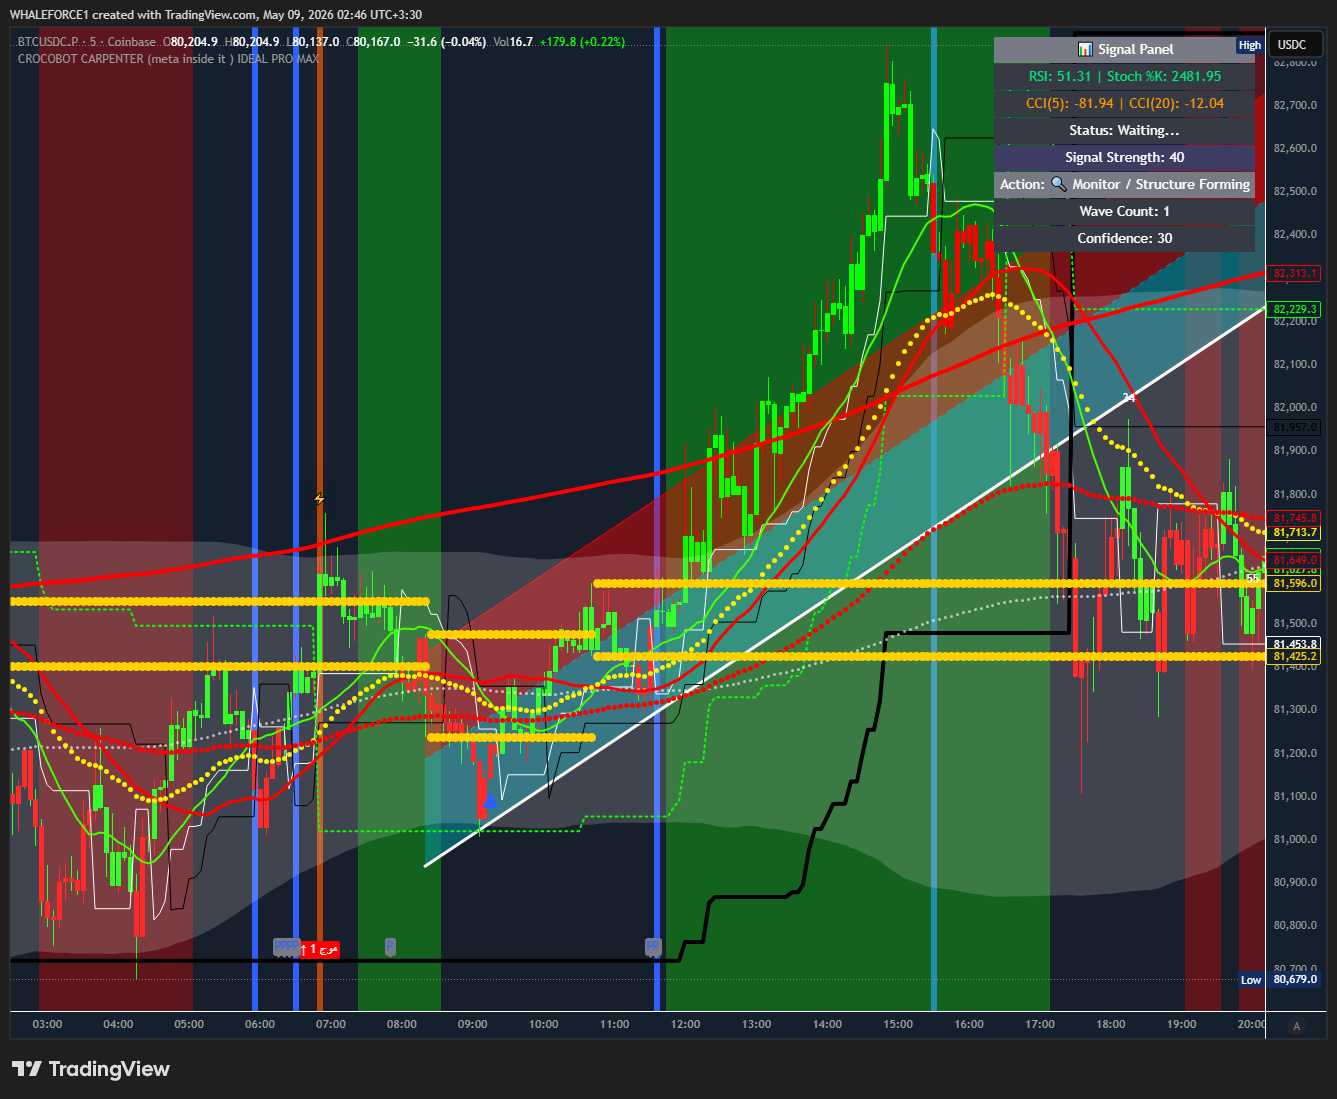
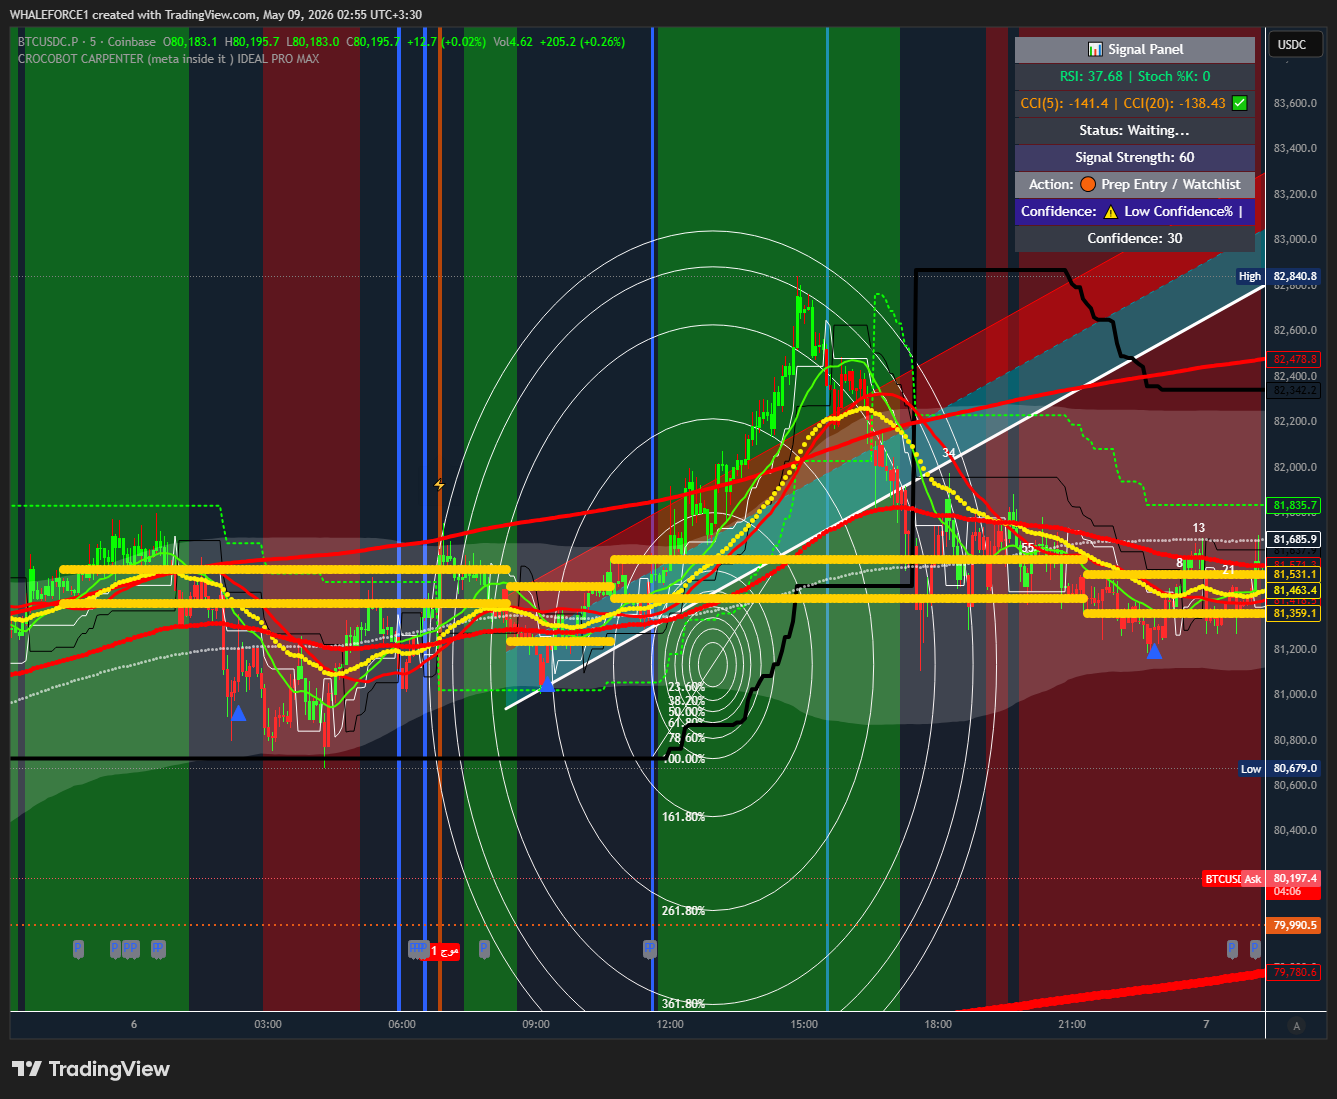
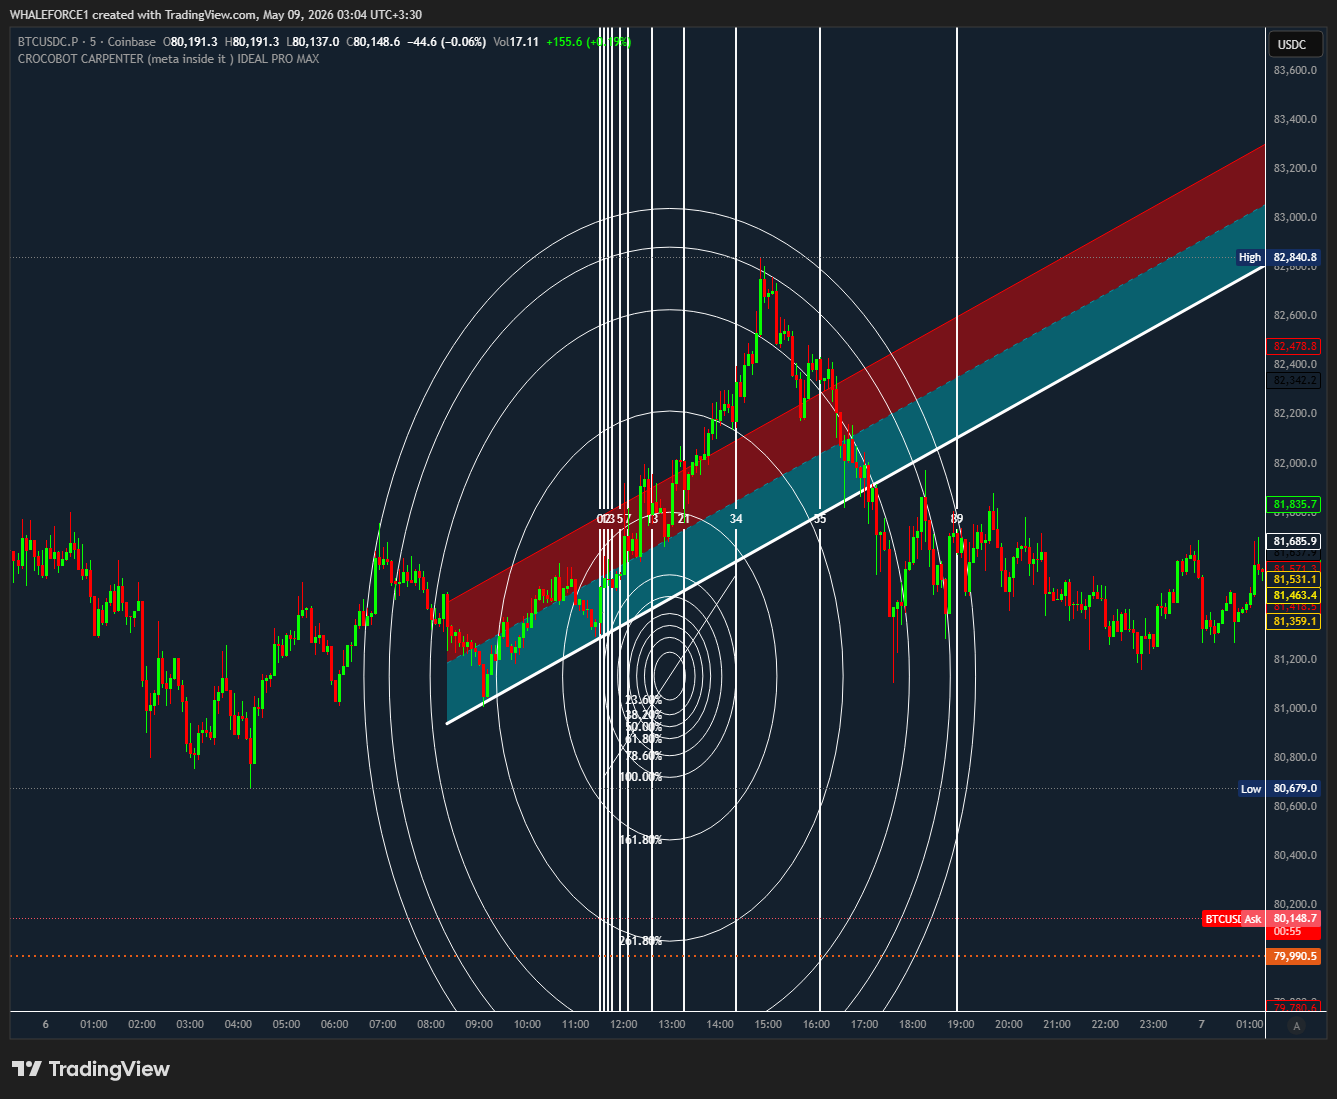
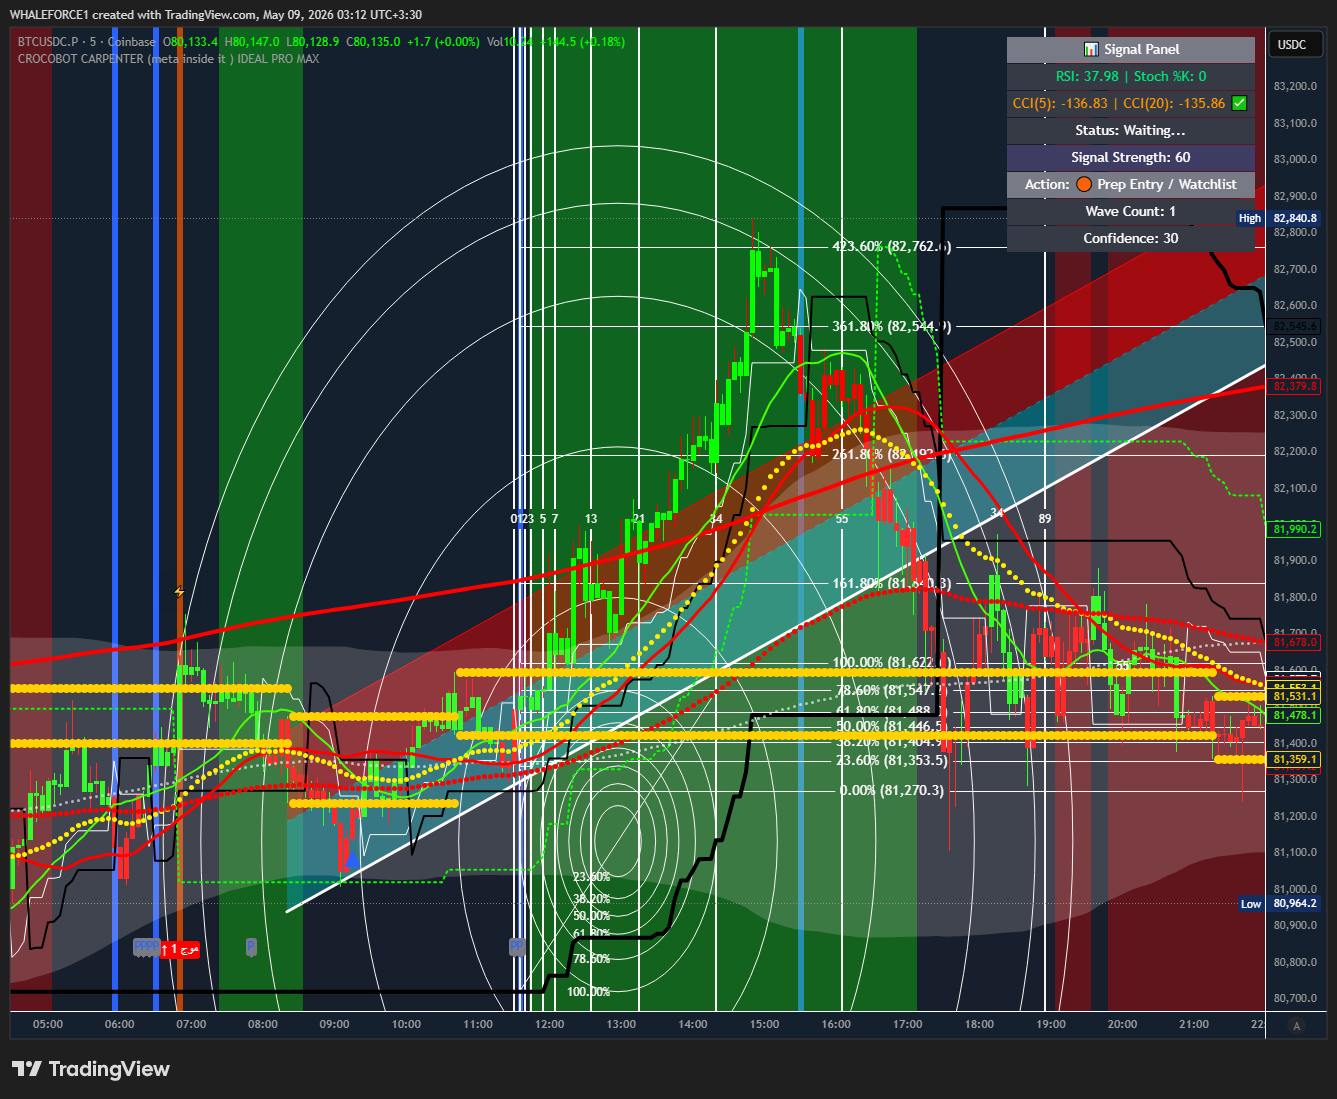
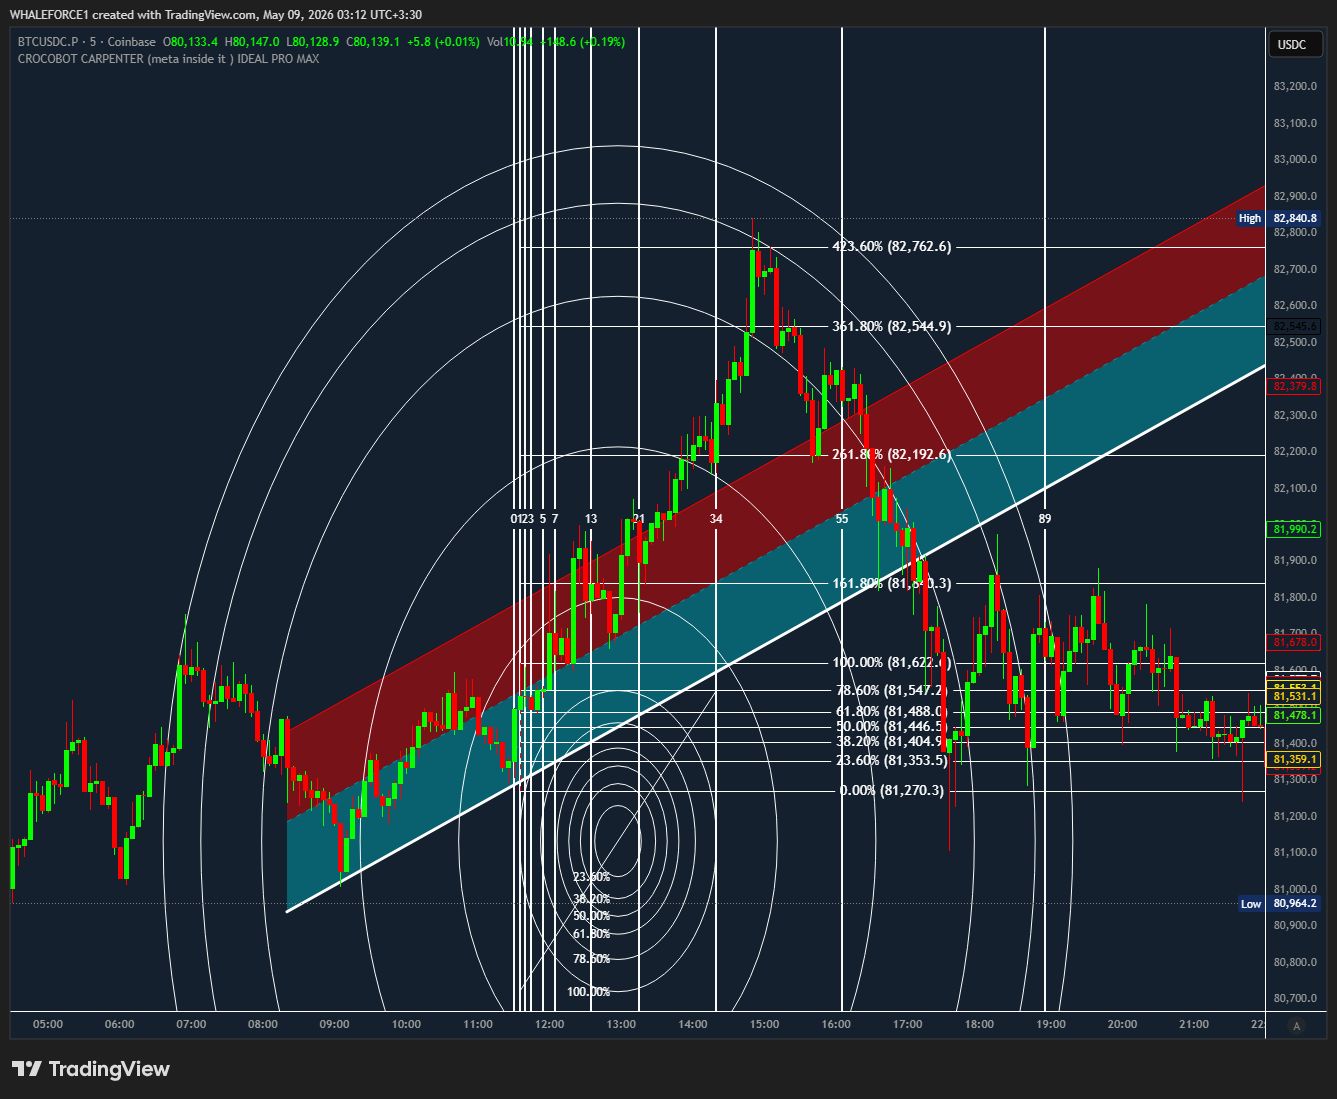
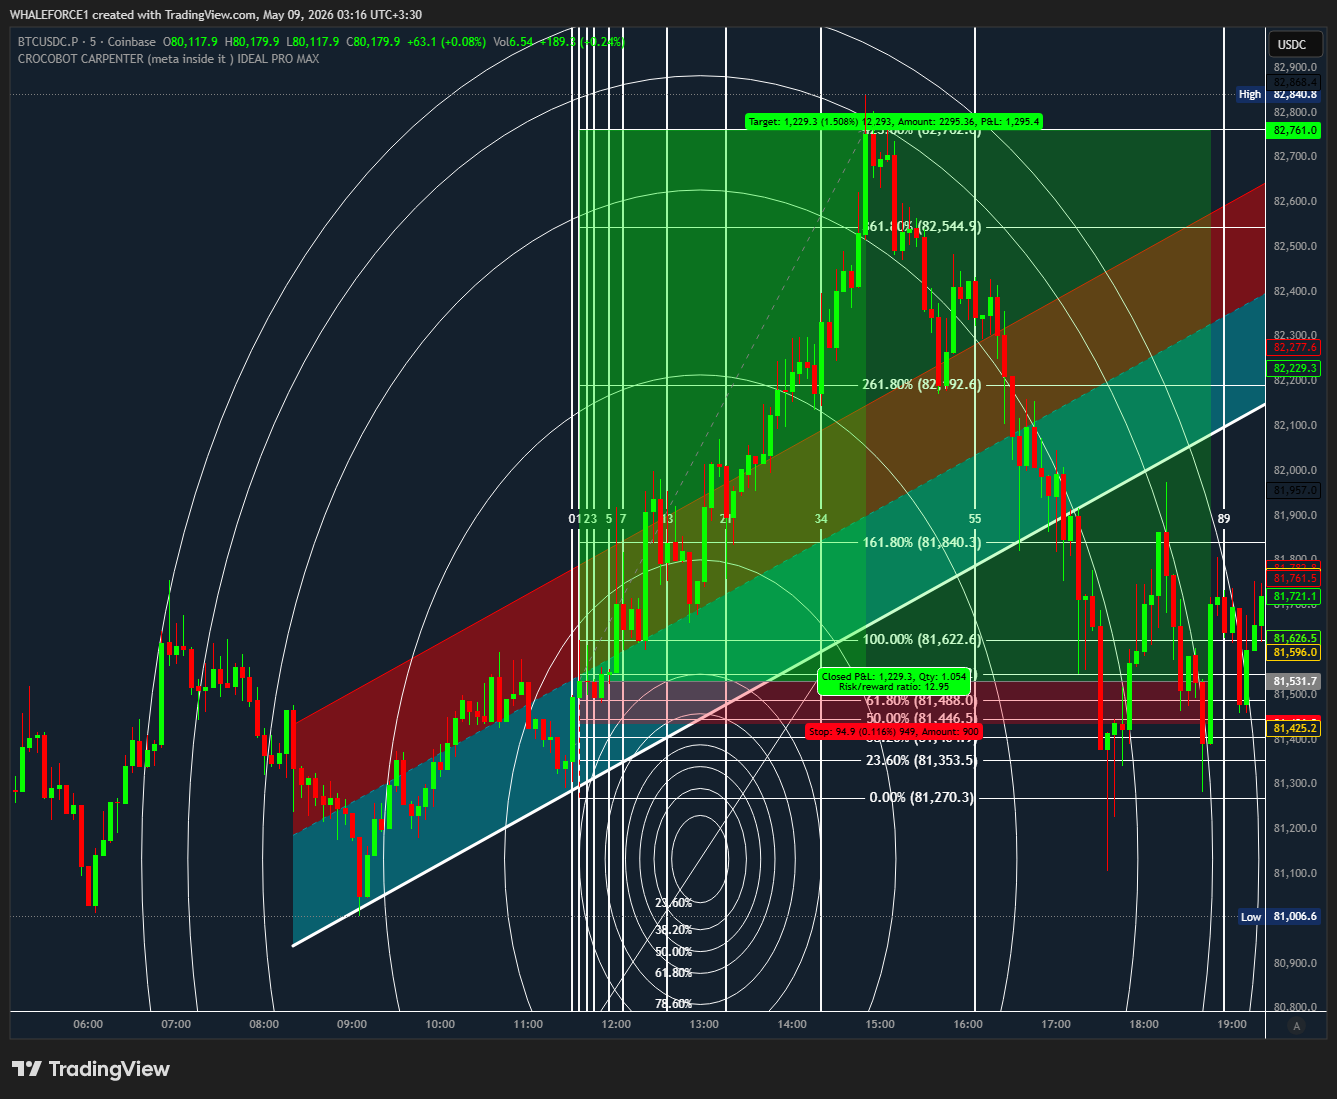
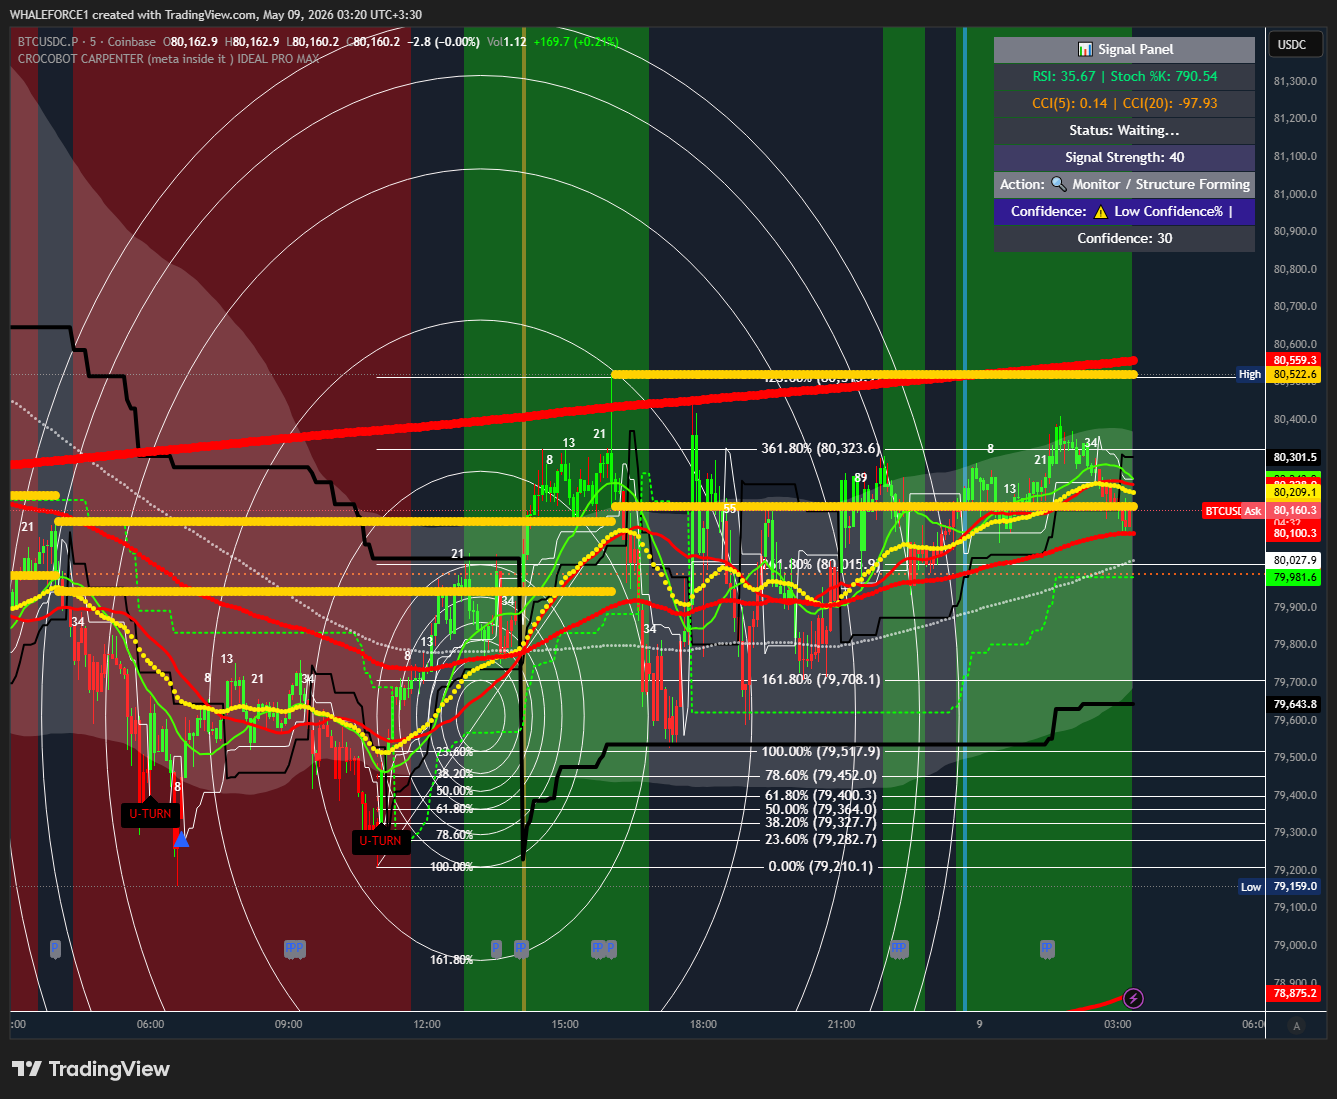
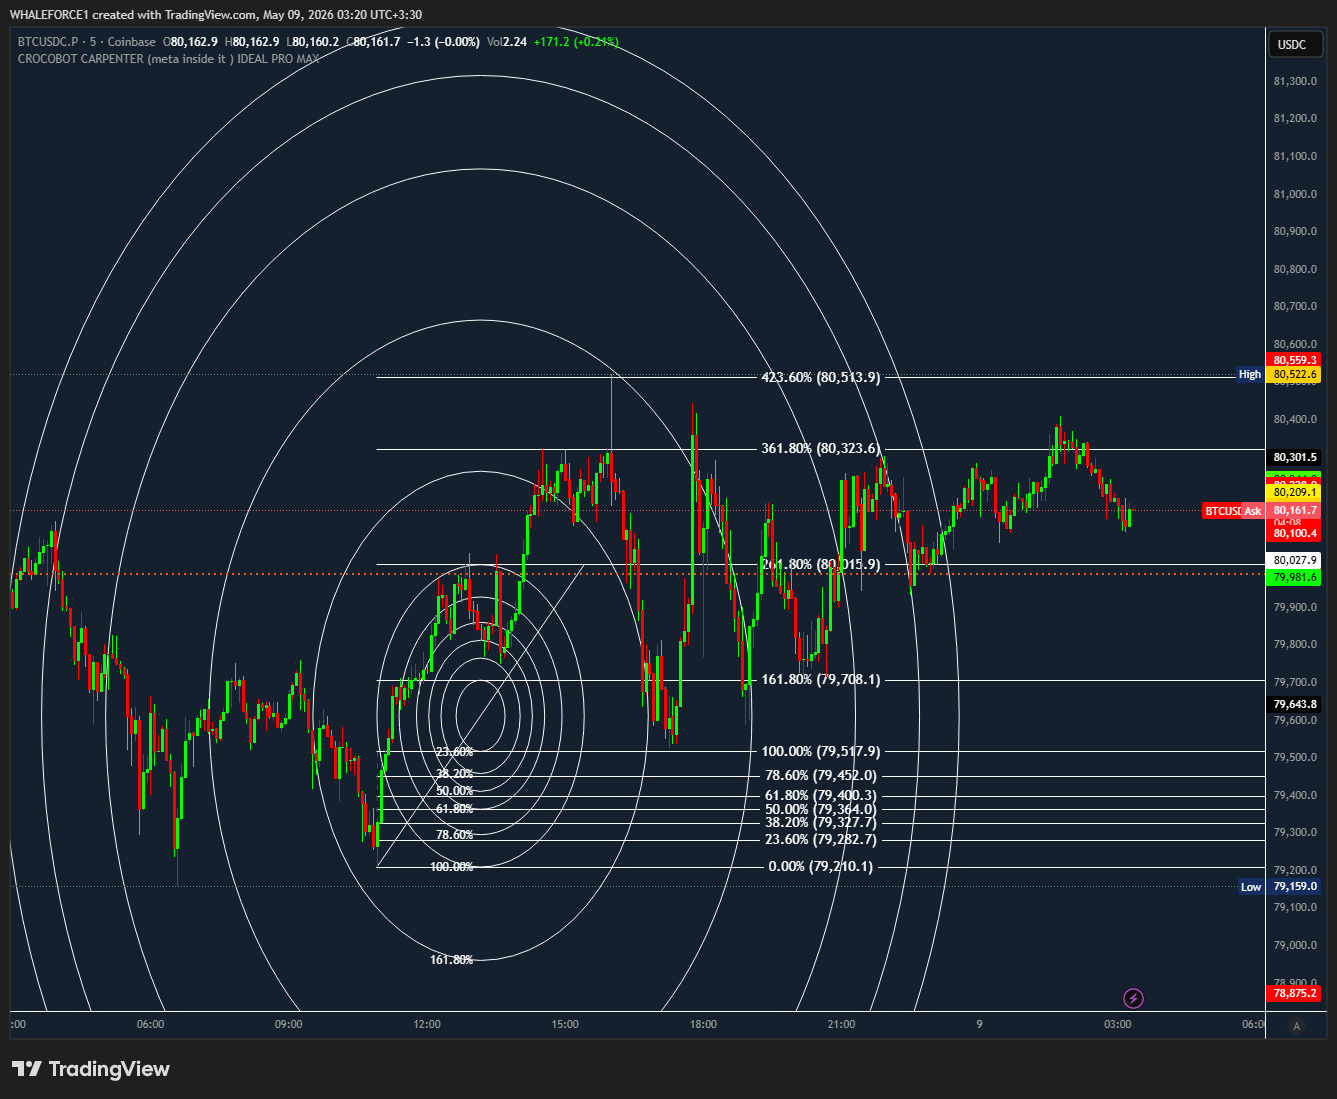
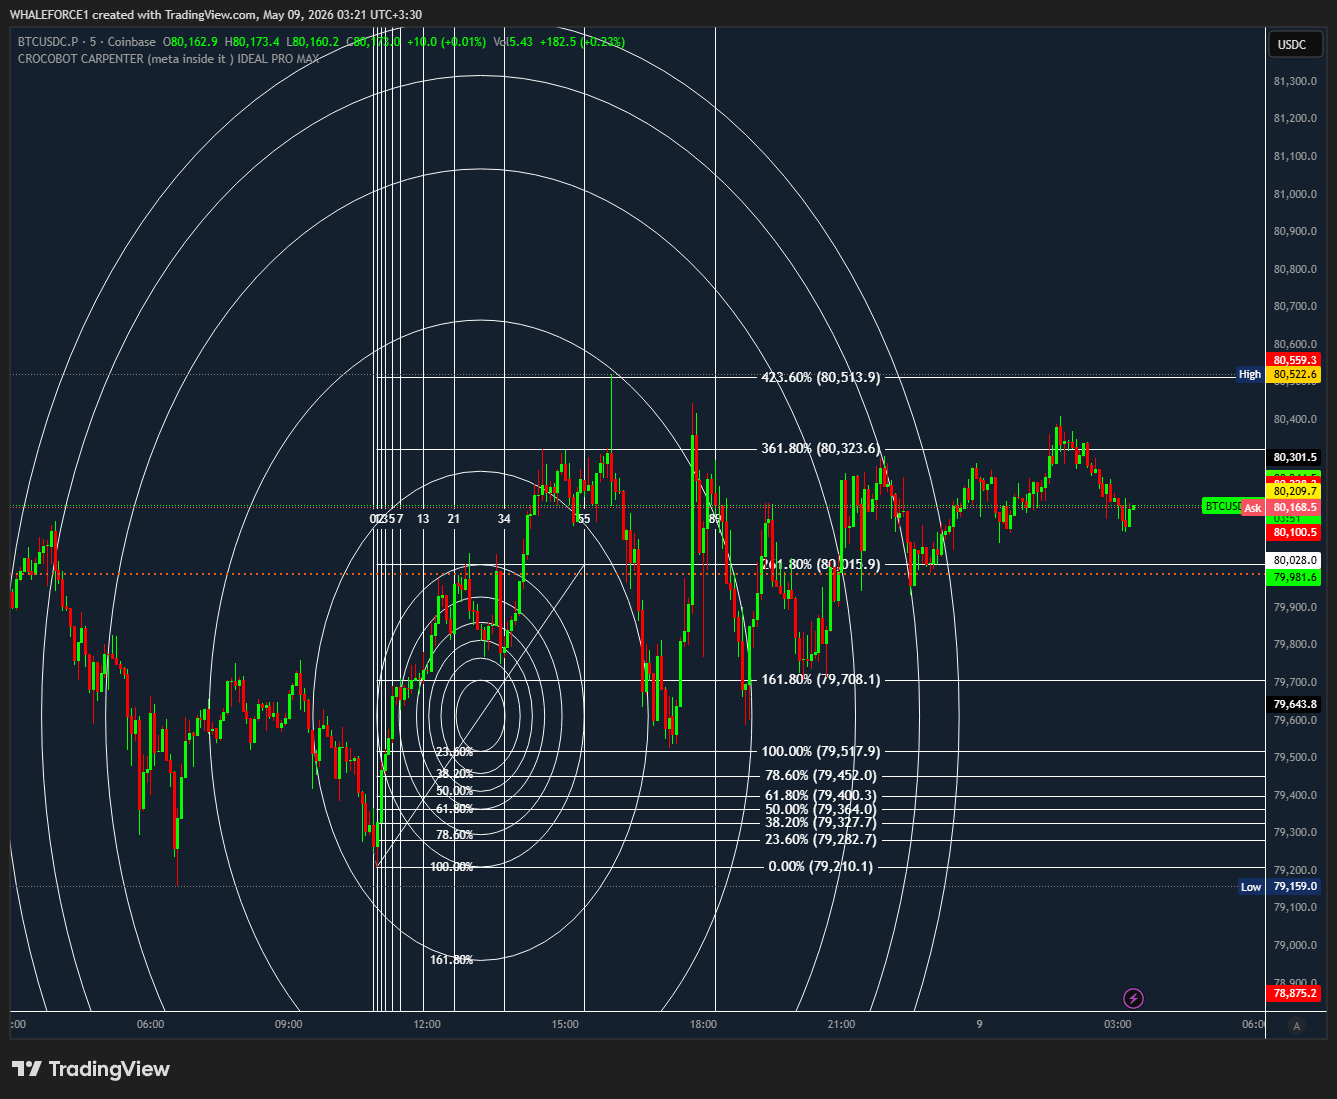
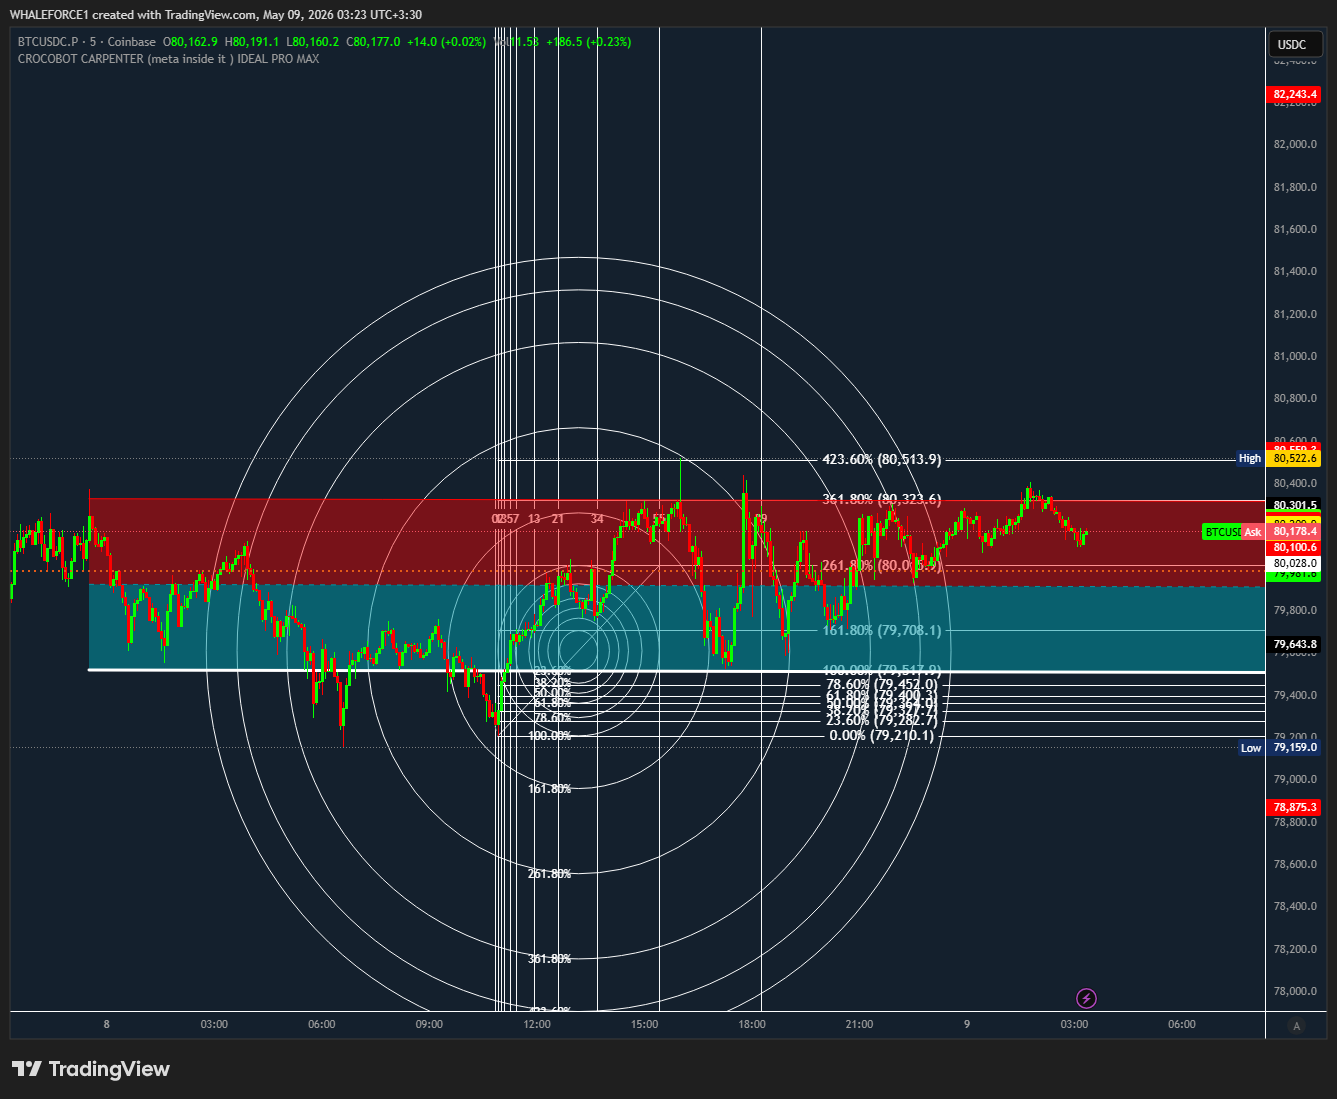
study("CROCOBOT CARPENTER (meta inside it ) IDEAL PRO MAX ", overlay=true)
// ——— Source: Mean of High, Low, Close, Open
src = (high + close + open) / 3
// ![]() Indicators
Indicators
stochK = stoch(src, src, src, 14)
rsiVal = rsi(src, 14)
cci5 = cci(src, 5)
cci20 = cci(src, 20)
// ![]() Oversold Conditions
Oversold Conditions
stochCond = stochK <= 20 //and stockD<= 20
rsiCond = rsiVal <= 30
cci5Cond = cci5 <= -100 or cci5 >= 100
cci20Cond = cci20 <= -100 or cci20 >= 100
// ![]() Previous Candle Conditions
Previous Candle Conditions
stochPrev = stochCond[1]
rsiPrev = rsiCond[1]
cci5Prev = cci5Cond[1]
cci20Prev = cci20Cond[1]
// ![]() Current Candle Rejection of All Conditions
Current Candle Rejection of All Conditions
stochNow = not stochCond
rsiNow = not rsiCond
cci5Now = not cci5Cond
cci20Now = not cci20Cond
// ![]() Transition Signal
Transition Signal
//transition = (stochPrev and rsiPrev) and (cci20Prev and cci5Now) and (stochNow and rsiNow) and (cci20Now and cci5Now) and crossover(atrTrailingStop1,atrTrailingStop2)
// ![]() Alert
Alert
//alertcondition(transition, title = “Oversold Recovery Transition”, message = “Previous candle met all oversold conditions, current candle rejects all. Possible momentum shift.”)
// ![]() Plot
Plot
//plotshape(transition, title = “Transition Marker”, location = location.abovebar, color = color.green, style = shape.labelup, text = “Shift”)
// ![]() User Inputs for Three ATRs
User Inputs for Three ATRs
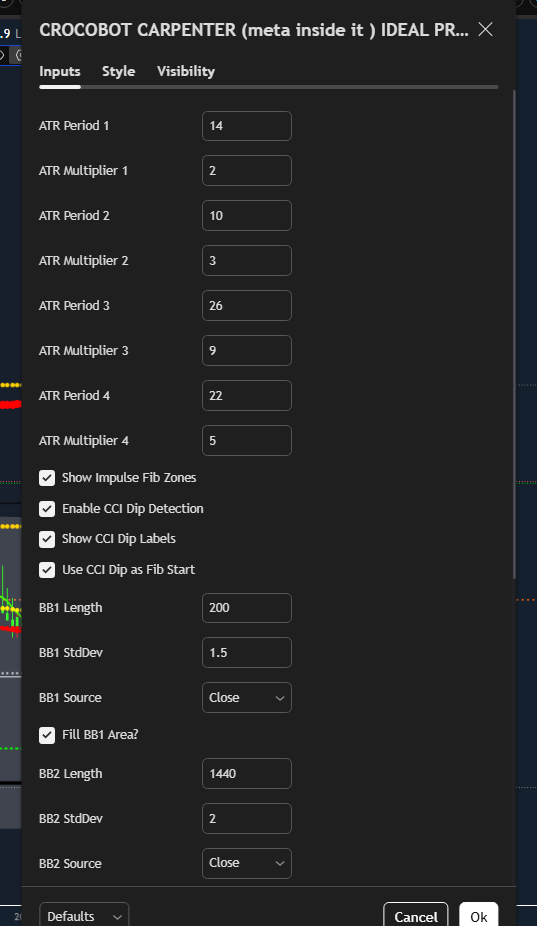
atrPeriod1 = input(14, title=“ATR Period 1”)
atrMultip1 = input(2, title=“ATR Multiplier 1”)
atrPeriod2 = input(10, title=“ATR Period 2”)
atrMultip2 = input(3, title=“ATR Multiplier 2”)
atrPeriod3 = input(26, title=“ATR Period 3”)
atrMultip3 = input(9, title=“ATR Multiplier 3”)
atrPeriod4 = input(22, title=“ATR Period 4”)
atrMultip4 = input(5, title=“ATR Multiplier 4”)
// ![]() Calculate ATR Values
Calculate ATR Values
atr1 = atr(atrPeriod1)
atr2 = atr(atrPeriod2)
atr3 = atr(atrPeriod3)
atr4 = atr(atrPeriod4)
loss1 = atrMultip1 * atr1
loss2 = atrMultip2 * atr2
loss3 = atrMultip3 * atr3
loss4 = atrMultip4 * atr4
// ![]() Trailing Stop Logic for Each ATR
Trailing Stop Logic for Each ATR
atrTrailingStop1 = float(na)
atrTrailingStop1 := close > nz(atrTrailingStop1[1], na) and close[1] > nz(atrTrailingStop1[1], na) ? max(nz(atrTrailingStop1[1], na), close - loss1) :
close < nz(atrTrailingStop1[1], na) and close[1] < nz(atrTrailingStop1[1], na) ? min(nz(atrTrailingStop1[1], na), close + loss1) :
close > nz(atrTrailingStop1[1], na) ? close - loss1 : close + loss1
atrTrailingStop2 = float(na)
atrTrailingStop2 := close > nz(atrTrailingStop2[1], na) and close[1] > nz(atrTrailingStop2[1], na) ? max(nz(atrTrailingStop2[1], na), close - loss2) :
close < nz(atrTrailingStop2[1], na) and close[1] < nz(atrTrailingStop2[1], na) ? min(nz(atrTrailingStop2[1], na), close + loss2) :
close > nz(atrTrailingStop2[1], na) ? close - loss2 : close + loss2
atrTrailingStop3 = float(na)
atrTrailingStop3 := close > nz(atrTrailingStop3[1], na) and close[1] > nz(atrTrailingStop3[1], na) ? max(nz(atrTrailingStop3[1], na), close - loss3) :
close < nz(atrTrailingStop3[1], na) and close[1] < nz(atrTrailingStop3[1], na) ? min(nz(atrTrailingStop3[1], na), close + loss3) :
close > nz(atrTrailingStop3[1], na) ? close - loss3 : close + loss3
atrTrailingStop4 = float(na)
atrTrailingStop4 := close > nz(atrTrailingStop4[1], na) and close[1] > nz(atrTrailingStop4[1], na) ? max(nz(atrTrailingStop4[1], na), close - loss4) :
close < nz(atrTrailingStop4[1], na) and close[1] < nz(atrTrailingStop4[1], na) ? min(nz(atrTrailingStop4[1], na), close + loss4) :
close > nz(atrTrailingStop4[1], na) ? close - loss4 : close + loss4
//
underATR = close < atrTrailingStop1 and close < atrTrailingStop2
aboveATR = close > atrTrailingStop1 and close > atrTrailingStop2
bullishCandle = close > atrTrailingStop1
bearishCandle = close <= atrTrailingStop1
barcolor(bullishCandle ? color.lime : bearishCandle ? color.red : na)
//barcolor(underATR ? color.rgb(255, 0, 0) : na) // ![]() Red for below ATRs
Red for below ATRs
//barcolor(aboveATR ? color.rgb(131, 255, 112) : na) // ![]() Green for above ATRs
Green for above ATRs
plot(atrTrailingStop1, color=color.rgb(255, 255, 255), linewidth=2, title=“ATR Stop 1”)
plot(atrTrailingStop2, color=color.rgb(0, 0, 0), linewidth=2, title=“ATR Stop 2”)
plot(atrTrailingStop3, color=color.rgb(255, 0, 0), linewidth=2, title=“ATR Stop 3”)
plot(atrTrailingStop4, color=color.rgb(0, 255, 21, 69), linewidth=2, title=“ATR Stop 4”)
transition = (stochPrev and rsiPrev) and (cci20Prev or cci5Prev) and (stochNow and rsiNow) and (cci20Now or cci5Now) and ((crossover(close,atrTrailingStop2) or crossover(close,atrTrailingStop1)) or crossover(close,atrTrailingStop3) or crossover(close,atrTrailingStop4))
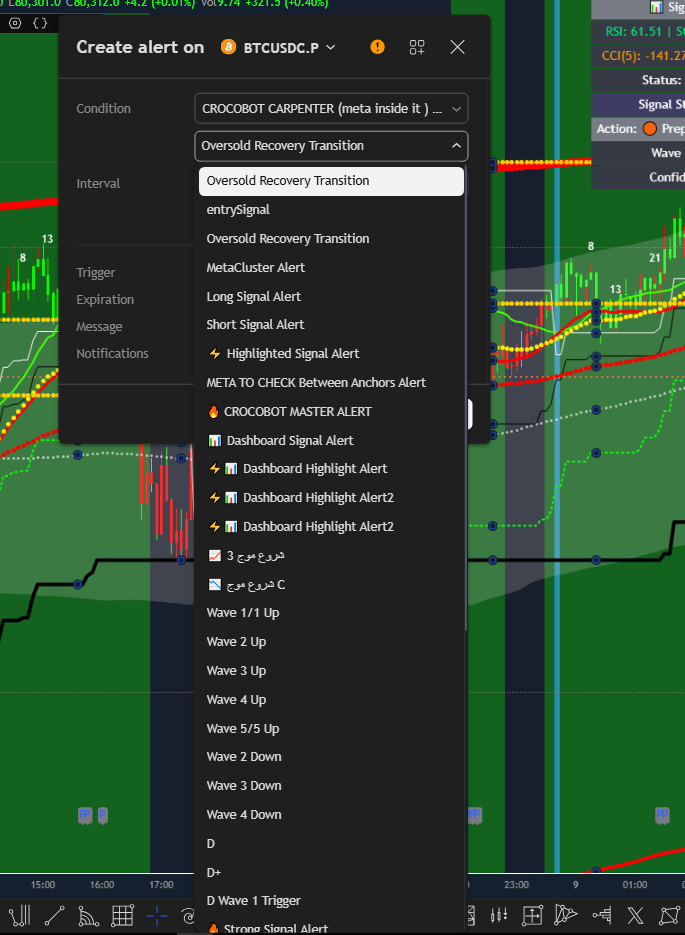
alertcondition(transition, title = “Oversold Recovery Transition”, message = “Previous candle met all oversold conditions, current candle rejects all. Possible momentum shift.”)
//plotshape(transition, title = “Transition Marker”, location = location.abovebar, color = color.green, style = shape.triangleup , size = size.small)
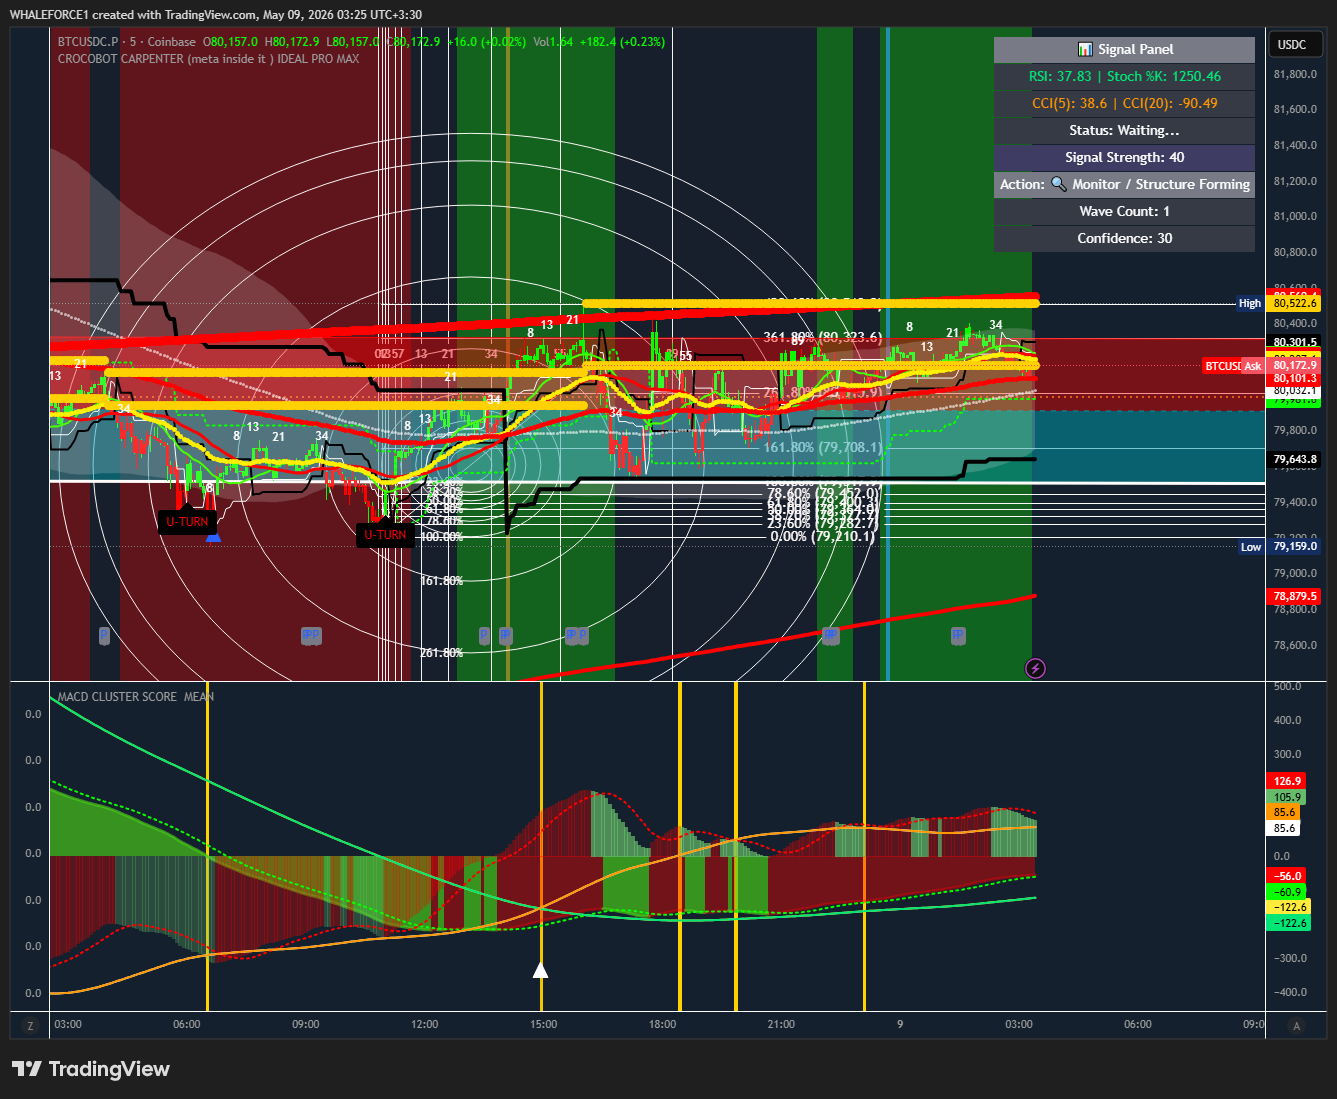
if (transition)
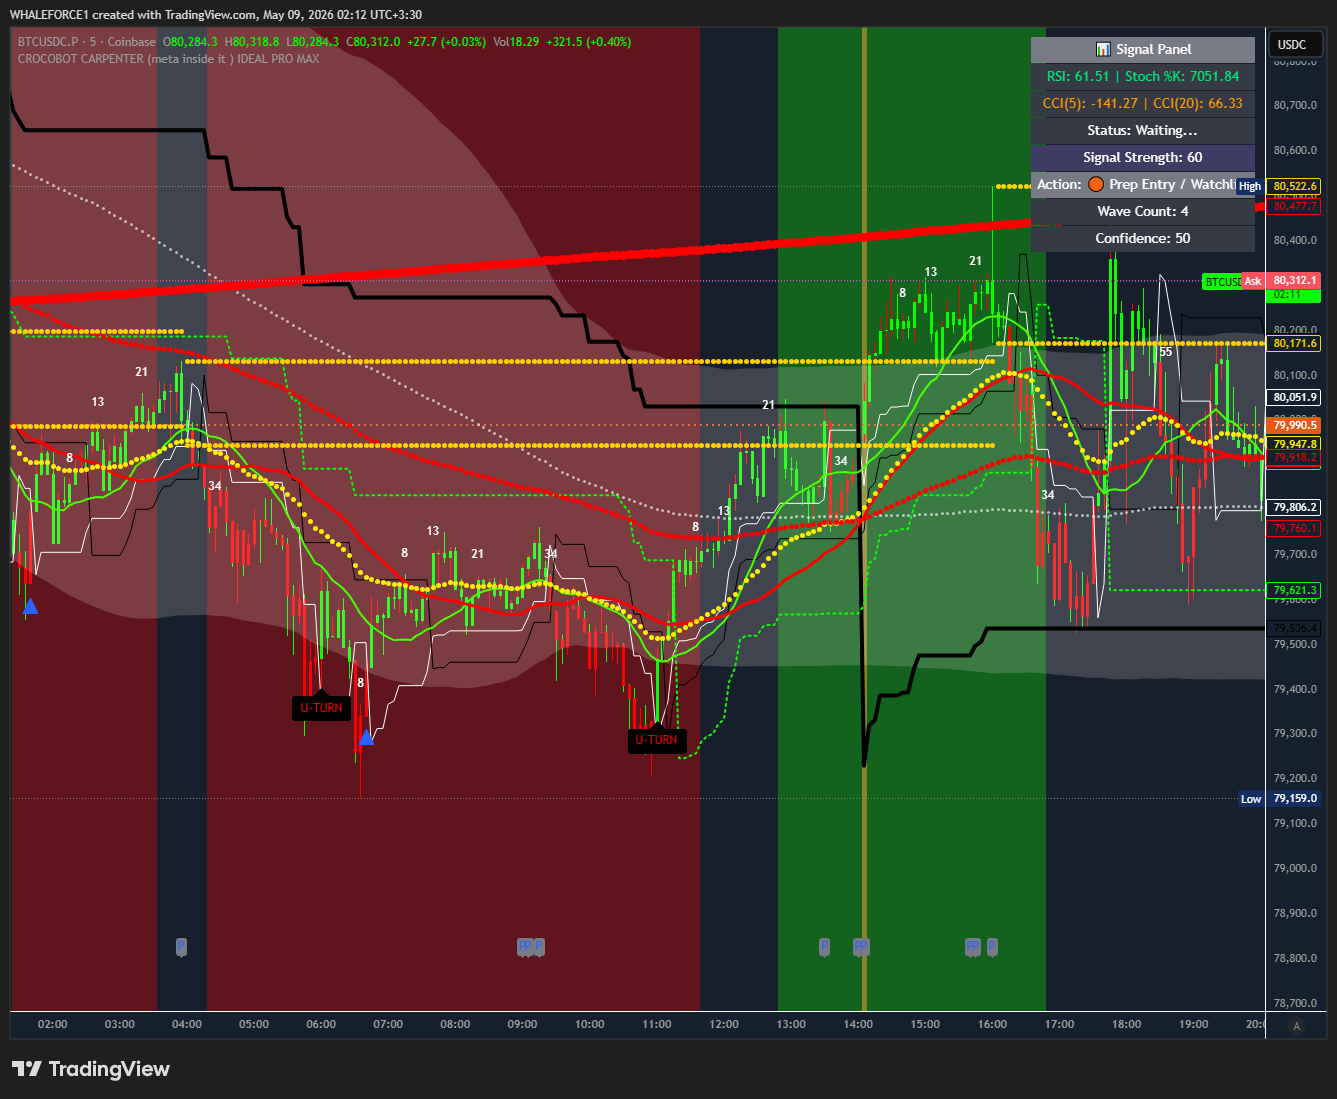
label.new(bar_index, low, text = “U-TURN”, style = label.style_label_up, color = color.rgb(0, 0, 0), textcolor = color.rgb(255, 0, 0), size = size.normal)
if (transition)
// Define rectangle bounds
top = low
bottom = low
left = bar_index
right = bar_index + 500
transition6 = (stochPrev and rsiPrev) and (stochNow and rsiNow) and (cci20Prev or cci5Prev) and (cci20Now or cci5Now)//and (crossover(close,atrTrailingStop2) or crossover(close,atrTrailingStop1) or crossover(close,atrTrailingStop3) or crossover(close,atrTrailingStop4))
plotshape(transition6, title = “Transition Marker”, location = location.abovebar, color = color.green, style = shape.triangleup , size = size.small)
//@version=4
//@author=LucemAnb
v=(transition6 and transition)
// Define Fractal Length
fractalLength = 2
// Detect Bullish Fractal (Higher Low)
bullishFractal = low[fractalLength] > low[fractalLength + 1] and low[fractalLength] > low[fractalLength - 1]
// Detect Bearish Fractal (Lower High)
bearishFractal = high[fractalLength] < high[fractalLength + 1] and high[fractalLength] < high[fractalLength - 1]
sma20 = sma(close, 20)
sma40 = sma(close, 40)
// === Signal Conditions ===
trendUp = sma20 > sma40
cciExhausted = (cci5 <= -100 or cci20 <= -100) or (cci5 >=100 or cci20 >= 100)
priceCrossed = open > sma20 or open < sma40
closedAboveSlow = close >= sma40 and (cross(close,atrTrailingStop1) or cross(close,atrTrailingStop2)) //or cross(close,atrTrailingStop3) or cross(close,atrTrailingStop4))
closedAboveSlow2=close >= sma40 and (cross(close,atrTrailingStop4) or cross(close,atrTrailingStop3))
entrySignal = trendUp and cciExhausted and priceCrossed and closedAboveSlow and atrTrailingStop1 > atrTrailingStop2 and atrTrailingStop2 > atrTrailingStop3
entrySignal2=trendUp and cciExhausted and priceCrossed and closedAboveSlow2
// === Plotting ===
//plot(sma20, color=color.green, title=“SMA 20”, linewidth=2)
//plot(sma40, color=color.red, title=“SMA 40”, linewidth=2)
//plotshape(entrySignal, location=location.belowbar, style=shape.triangleup, color=color.lime, size=size.small, title=“Entry Signal”)
bgcolor(entrySignal ? color.rgb(0, 255, 127, 15) : na)
//plotshape(entrySignal2, location=location.belowbar, style=shape.triangleup, color=color.lime, size=size.small, title=“Entry Signal”)
bgcolor(entrySignal2 ? color.new(color.green, 85) : na)
alertcondition(entrySignal or entrySignal2, title = “entrySignal”, message = “entrySignal”)
alertcondition((transition6 and transition) or (entrySignal and entrySignal2), title = “Oversold Recovery Transition”, message = “Previous candle met all oversold conditions, current candle rejects all. Possible momentum shift.”)
bullishSignal = entrySignal2 or transition or entrySignal or transition6
//combinedAlert = bullishSignal
// ===============================
// ![]() Signal Candle Low Capture & SL Alert
Signal Candle Low Capture & SL Alert
// ===============================
// ===============================
// ![]() Signal Candle Low + SL Alert
Signal Candle Low + SL Alert
// ===============================
var float signalCandleLow = na
signalCandleLow := bullishSignal ? high : signalCandleLow[1]
//plot(signalCandleLow, title=“Signal Candle Low (SL Level)”, color=color.red, style=plot.style_line)
//alertcondition(crossunder(close, signalCandleLow), title=“SL Breach Alert”, message=“Price crossed below signal candle low.”)
// ===============================
// ![]() Reversed Fibonacci Retracement
Reversed Fibonacci Retracement
// Uses TrailingStop2 vs signal candle for structural pullback mapping
// ===============================
useStopAsFib0 = bullishSignal and atrTrailingStop2 < signalCandleLow
revFibStart = useStopAsFib0 ? atrTrailingStop2 : signalCandleLow
revFibEnd = useStopAsFib0 ? signalCandleLow : atrTrailingStop2
revFib100 = revFibStart
revFib786 = revFibStart + (revFibEnd - revFibStart) * 0.786
revFib618 = revFibStart + (revFibEnd - revFibStart) * 0.618
revFib50 = revFibStart + (revFibEnd - revFibStart) * 0.5
revFib382 = revFibStart + (revFibEnd - revFibStart) * 0.382
revFib236 = revFibStart + (revFibEnd - revFibStart) * 0.236
revFib0 = revFibEnd
//plot(bullishSignal ? revFib100 : na, title=“Rev Fib 0%”, color=color.blue, linewidth=2)
//plot(bullishSignal ? revFib786 : na, title=“Rev Fib 78.6%”, color=color.green, linewidth=2)
//plot(bullishSignal ? revFib618 : na, title=“Rev Fib 61.8%”, color=color.orange, linewidth=2)
//plot(bullishSignal ? revFib50 : na, title=“Rev Fib 50%”, color=color.red, linewidth=2)
//plot(bullishSignal ? revFib382 : na, title=“Rev Fib 38.2%”, color=color.purple, linewidth=2)
//plot(bullishSignal ? revFib236 : na, title=“Rev Fib 23.6%”, color=color.yellow, linewidth=2)
//plot(bullishSignal ? revFib0 : na, title=“Rev Fib 100%”, color=color.white, linewidth=2)
// ===============================
// ![]() Fibonacci Extension Levels (Take Profit Targets)
Fibonacci Extension Levels (Take Profit Targets)
// Now realigned to project upwards from the bullish structure
// ===============================
extFibStart = atrTrailingStop2 // Use candle low for bullish anchor
extFibEnd = high // Use candle high for bullish move reference
extFib1618 = extFibEnd + (extFibEnd - extFibStart) * 0.618
extFib2618 = extFibEnd + (extFibEnd - extFibStart) * 1.618
extFib3618 = extFibEnd + (extFibEnd - extFibStart) * 2.618
extFib4236 = extFibEnd + (extFibEnd - extFibStart) * 3.236
//plot(bullishSignal ? extFib1618 : na, title=“TP1 - Fib 1.618”, color=color.blue, linewidth=2)
//plot(bullishSignal ? extFib2618 : na, title=“TP2 - Fib 2.618”, color=color.green, linewidth=2)
//plot(bullishSignal ? extFib3618 : na, title=“TP3 - Fib 3.618”, color=color.purple, linewidth=2)
//plot(bullishSignal ? extFib4236 : na, title=“TP4 - Fib 4.236”, color=color.orange, linewidth=2)
// Inputs
showImpulseZones = input(true, title=“Show Impulse Fib Zones”)
// Impulse anchor logic
var float fibStart = na
var float fibEnd = na
fibStart := bullishSignal ? atrTrailingStop2 : fibStart[1]
fibEnd := bullishSignal ? close : fibEnd[1]
// Fib reversal zone calculations
fib618 = fibEnd - (fibEnd - fibStart) * 0.618
fib786 = fibEnd - (fibEnd - fibStart) * 0.786
// Plot impulse markers
//plotshape(showImpulseZones and bullishSignal, location=location.belowbar, color=color.green, style=shape.triangleup, title=“Impulse Fib Start”)
//plotshape(showImpulseZones and bullishSignal, location=location.abovebar, color=color.red, style=shape.triangledown, title=“Impulse Fib End”)
// Plot fib reversal zones
//plot(showImpulseZones ? fib618 : na, color=color.orange, title=“Impulse Fib 61.8%”)
//plot(showImpulseZones ? fib786 : na, color=color.purple, title=“Impulse Fib 78.6%”)
// === INPUTS ===
enableCCIDipLogic = input(true, title=“Enable CCI Dip Detection”)
showDipLabels = input(true, title=“Show CCI Dip Labels”)
useDipAsFibStart = input(true, title=“Use CCI Dip as Fib Start”)
// === Dip Detection Logic ===
wasExhausted = cci5[1] <= -100 and cci20[1] <= -100
dipFormed = enableCCIDipLogic and cci5 > -100 and cci20 <= -100 and wasExhausted
wasntExhausted = cci5[1] >= 100 and cci20[1] >= 100
dipntFormed = enableCCIDipLogic and cci5 >= 100 and cci20 >=100 and wasntExhausted
// === Visual Marker ===
//plotshape(dipFormed, location=location.belowbar, style=shape.circle, color=color.orange, title=“CCI Dip Formed”)
//plotshape(dipntFormed, location=location.belowbar, style=shape.circle, color=color.orange, title=“CCI Dipnt Formed”)
// === INPUTS ===
// Bollinger Bands Set 1
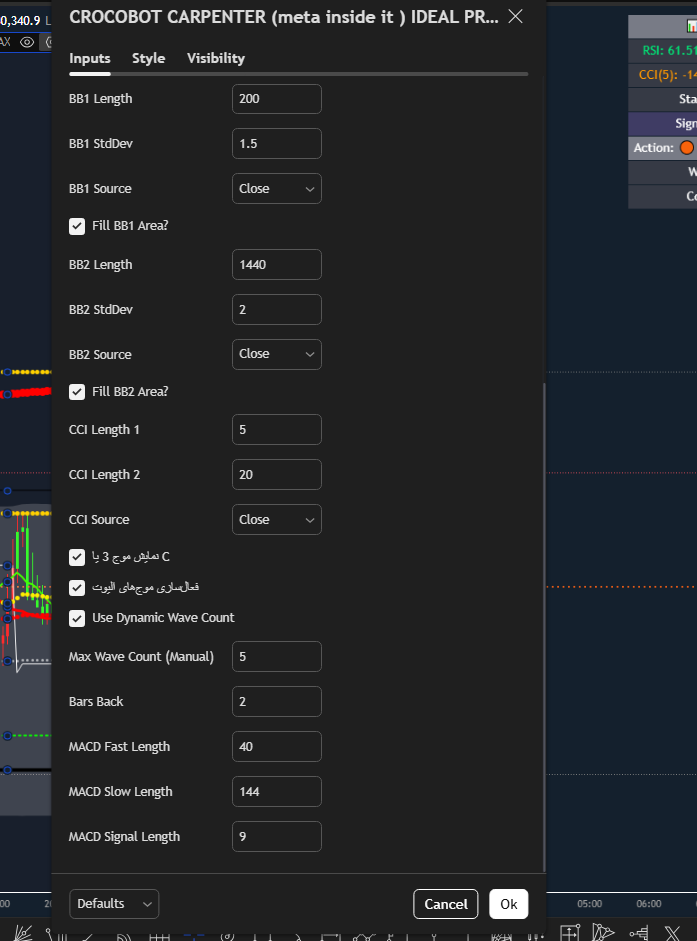
bb1_len = input(20, title=“BB1 Length”)
bb1_std = input(2.0, title=“BB1 StdDev”)
bb1_src = input(close, title=“BB1 Source”)
bb1_fill = input(true, title=“Fill BB1 Area?”)
// Bollinger Bands Set 2
bb2_len = input(50, title=“BB2 Length”)
bb2_std = input(2.5, title=“BB2 StdDev”)
bb2_src = input(close, title=“BB2 Source”)
bb2_fill = input(true, title=“Fill BB2 Area?”)
// === CCI Inputs ===
cci_len1 = input(5, title=“CCI Length 1”)
cci_len2 = input(20, title=“CCI Length 2”)
cci_src = input(close, title=“CCI Source”)
// === CALCULATIONS ===
// Bollinger Bands 1
bb1_basis = sma(bb1_src, bb1_len)
bb1_upper = bb1_basis + bb1_std * stdev(bb1_src, bb1_len)
bb1_lower = bb1_basis - bb1_std * stdev(bb1_src, bb1_len)
// Bollinger Bands 2
bb2_basis = sma(bb2_src, bb2_len)
bb2_upper = bb2_basis + bb2_std * stdev(bb2_src, bb2_len)
bb2_lower = bb2_basis - bb2_std * stdev(bb2_src, bb2_len)
ema40 = ema(close, 40)
ema144 = ema(close, 144)
// === PLOTTING ===
// Bollinger Bands 1
plot(bb1_basis, title=“BB1 Basis”, color=color.orange)
p1u = plot(bb1_upper, title=“BB1 Upper”, color=color.orange, linewidth=1)
p1l = plot(bb1_lower, title=“BB1 Lower”, color=color.orange, linewidth=1)
// Bollinger Bands 2
plot(bb2_basis, title=“BB2 Basis”, color=color.purple)
p2u = plot(bb2_upper, title=“BB2 Upper”, color=color.purple, linewidth=1)
p2l = plot(bb2_lower, title=“BB2 Lower”, color=color.purple, linewidth=1)
// Fill Areas
fill(p1u, p1l, color=bb1_fill ? color.orange : color.new(color.orange, 100), transp=85, title=“BB1 Fill”)
fill(p2u, p2l, color=bb2_fill ? color.purple : color.new(color.purple, 100), transp=85, title=“BB2 Fill”)
// Moving Averages
plot(sma20, title=“SMA 20”, color=color.blue, linewidth=2)
plot(sma40, title=“SMA 40”, color=color.green, linewidth=2)
plot(ema40, title=“EMA 40”, color=color.red, linewidth=2)
plot(ema144, title=“EMA 144”, color=color.fuchsia, linewidth=2)
// === BACKGROUND COLOR ===
//bgcolor(extreme_cci ? color.white : na, transp=0)
// === CCI Calculations ===
cci1 = cci(cci_src, cci_len1)
cci2 = cci(cci_src, cci_len2)
// === Anchor Levels ===
anchor1 = low - tr * 2 // Line for CCI(5)
anchor2 = low - tr * 3 // Line for CCI(20)
// — Signal Flags —
isEntry = entrySignal or entrySignal2
isTransition = transition or transition6
isDip = dipFormed
isFibZone = close >= fib618 and close <= fib786
isFractal = bullishFractal
isAboveATR = close > atrTrailingStop1 and close > atrTrailingStop2
// — Cluster Scoring —
clusterScore = (isEntry ? 2 : 0) +(isTransition ? 2 : 0) + (isDip ? 1 : 0) + (isFibZone ? 1 : 0) +(isFractal ? 1 : 0) + (isAboveATR ? 1 : 0)
// — Threshold for Meta-Signal —
metaSignal = clusterScore >= 4
// — Visual Marker —
plotshape(metaSignal, location=location.abovebar, style=shape.labelup, color=color.fuchsia, text=“META”, title=“MetaCluster Signal”)
// — Alert —
alertcondition(metaSignal, title=“MetaCluster Alert”, message=“Multiple modules aligned. High-conviction zone detected.”)
// — Optional: Score Label —
//plotshape(metaSignal, location=location.abovebar, style=shape.labelup, color=color.fuchsia, text=“META”, title=“MetaCluster Signal”)
// — Optional: Background Heatmap —
//bgcolor(clusterScore >= 5 ? color.new(color.green, 85) : na)
//alertcondition(bullishSignal and cross(close, atrTrailingStop3), title=“ATR3 Cross”, message="Price crossed ATR Trailing Stop
// === Dual Fractal Detection ===
isBullFractal = low[2] > low[1] and low[1] < low and low[1] < low[3] and low[1] < low[4]
isBearFractal = high[2] < high[1] and high[1] > high and high[1] > high[3] and high[1] > high[4]
isDualFractal = isBullFractal and isBearFractal
//plotshape(isDualFractal, title=“Dual Fractal”, location=location.abovebar, color=color.orange, style=shape.triangleup, size=size.small)
// === Store Fractal Levels (Persistent)
var float anchorHigh = na
var float anchorLow = na
anchorHigh := isDualFractal ? high[1] : anchorHigh
anchorLow := isDualFractal ? low[1] : anchorLow
// === Draw Horizontal Lines
plot(not na(anchorHigh) ? anchorHigh : na, title=“Fractal High”, color=color.red, style=plot.style_circles )
plot(not na(anchorLow) ? anchorLow : na, title=“Fractal Low”, color=color.green, style=plot.style_circles)
// === Price Crossover Detection
longSignal = not na(anchorHigh) and crossover(close, anchorHigh)
shortSignal = not na(anchorLow) and crossunder(close, anchorLow)
//plotshape(longSignal, title=“Long Signal”, location=location.belowbar, color=color.rgb(0, 255, 8), style=shape.labelup, text=“L”)
//plotshape(shortSignal, title=“Short Signal”, location=location.abovebar, color=color.rgb(255, 0, 0), style=shape.labeldown, text=“S”)
alertcondition(longSignal, title=“Long Signal Alert”, message=“Price crossed above fractal low → L”)
alertcondition(shortSignal, title=“Short Signal Alert”, message=“Price crossed below fractal high → S”)